
Assessing biodiversity and physical risk using LEAP
Auquan assists clients on biodiversity and physical risk assessment, using the LEAP Nature Risk Assessment Approach suggested by TNFD.
LEAP stands for:
- Locate your company's/ your portfolios' interface with nature;
- Evaluate your company's/ your portfolios dependencies and impacts;
- Assess your company's/ your portfolios risks and opportunities; and
- Prepare to respond to nature-related risks and opportunities and report.
LOCATE
As a part of the Locate step, Auquan collects exhaustive location data on companies from self reported and third party information, down to location coordinates, to identify all material operational locations of a company (and it's subsidiaries) or a portfolio of companies. The screenshot below shows a sample from 100+ fully owned farms of the Brazilian company JBS S.A. - the largest meat processing company in the world.
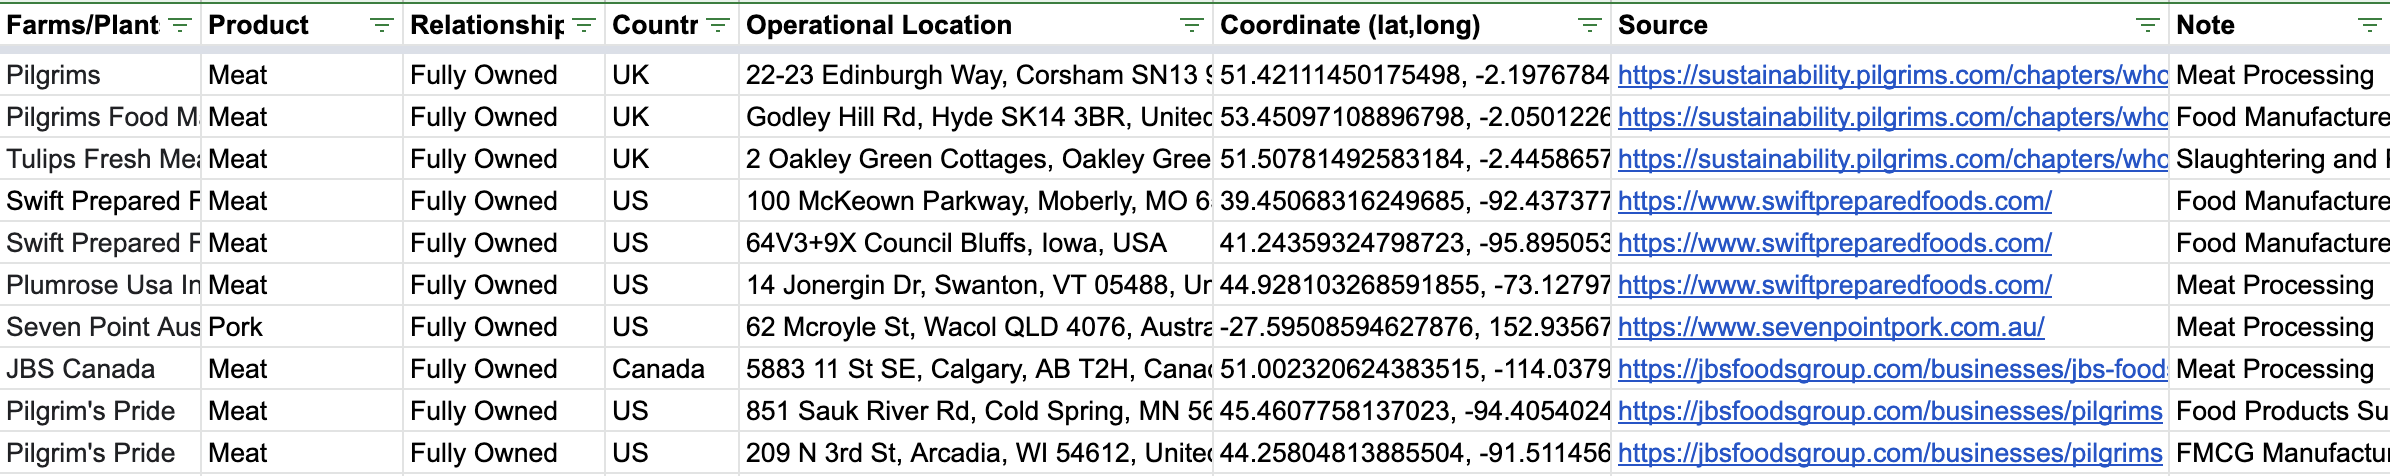
Note the data includes locations of various subsidiaries such as Pilgrims or Tulips Fresh Meat as well.
EVALUATE
As a part of the Evaluate step, Auquan identifies how a company's activities rely on natural capital, as well as the impact they have on environment, using the ENCORE framework. The screenshot below shows the ecosystem dependencies and impact for JBS - both direct and through its suppliers.

ASSESS
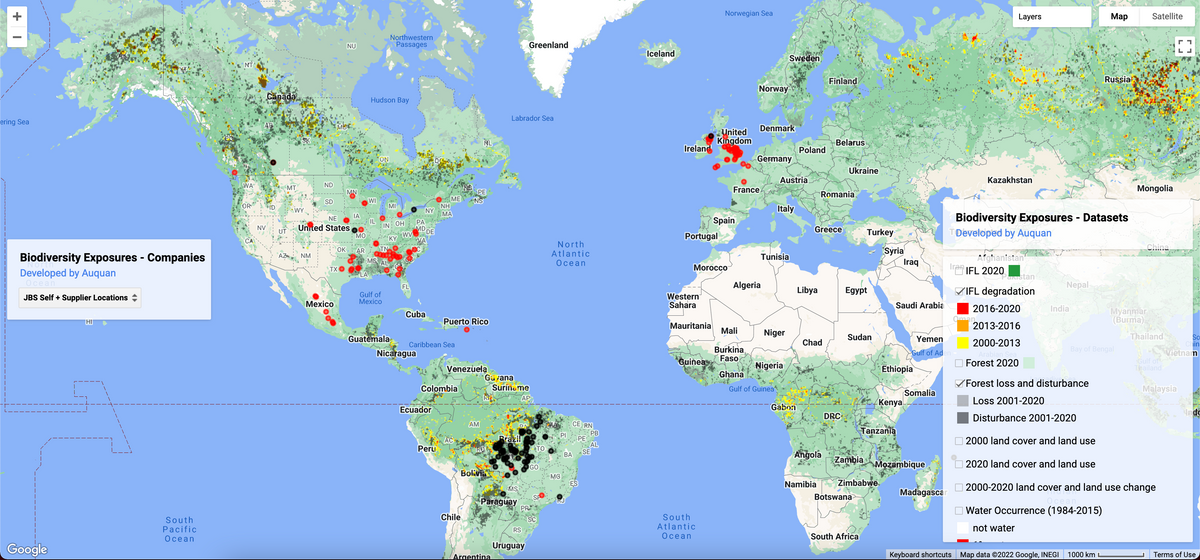
Finally, Auquan offers the ability to map the operational locations of a company or its suppliers and overlay the right geospatial datasets, based on the dependencies and impacts identified in the evaluate phase, to better assess a company's direct and indirect impact on the environment.
For JBS SA, a key impact is deforestation, so the map below shows the operational company locations, identified in locate step (red pins), overlaid on top of intact forest loss data (mapped by Greenpeace and WRI) and Global Forest Loss data (mapped by GLAD lab), to understand how forest resources have changed around the company’s operations.
We can see some patches of deforestation around southern states in the US, so zooming in on the region indeed shows forest loss around JBS' operations.

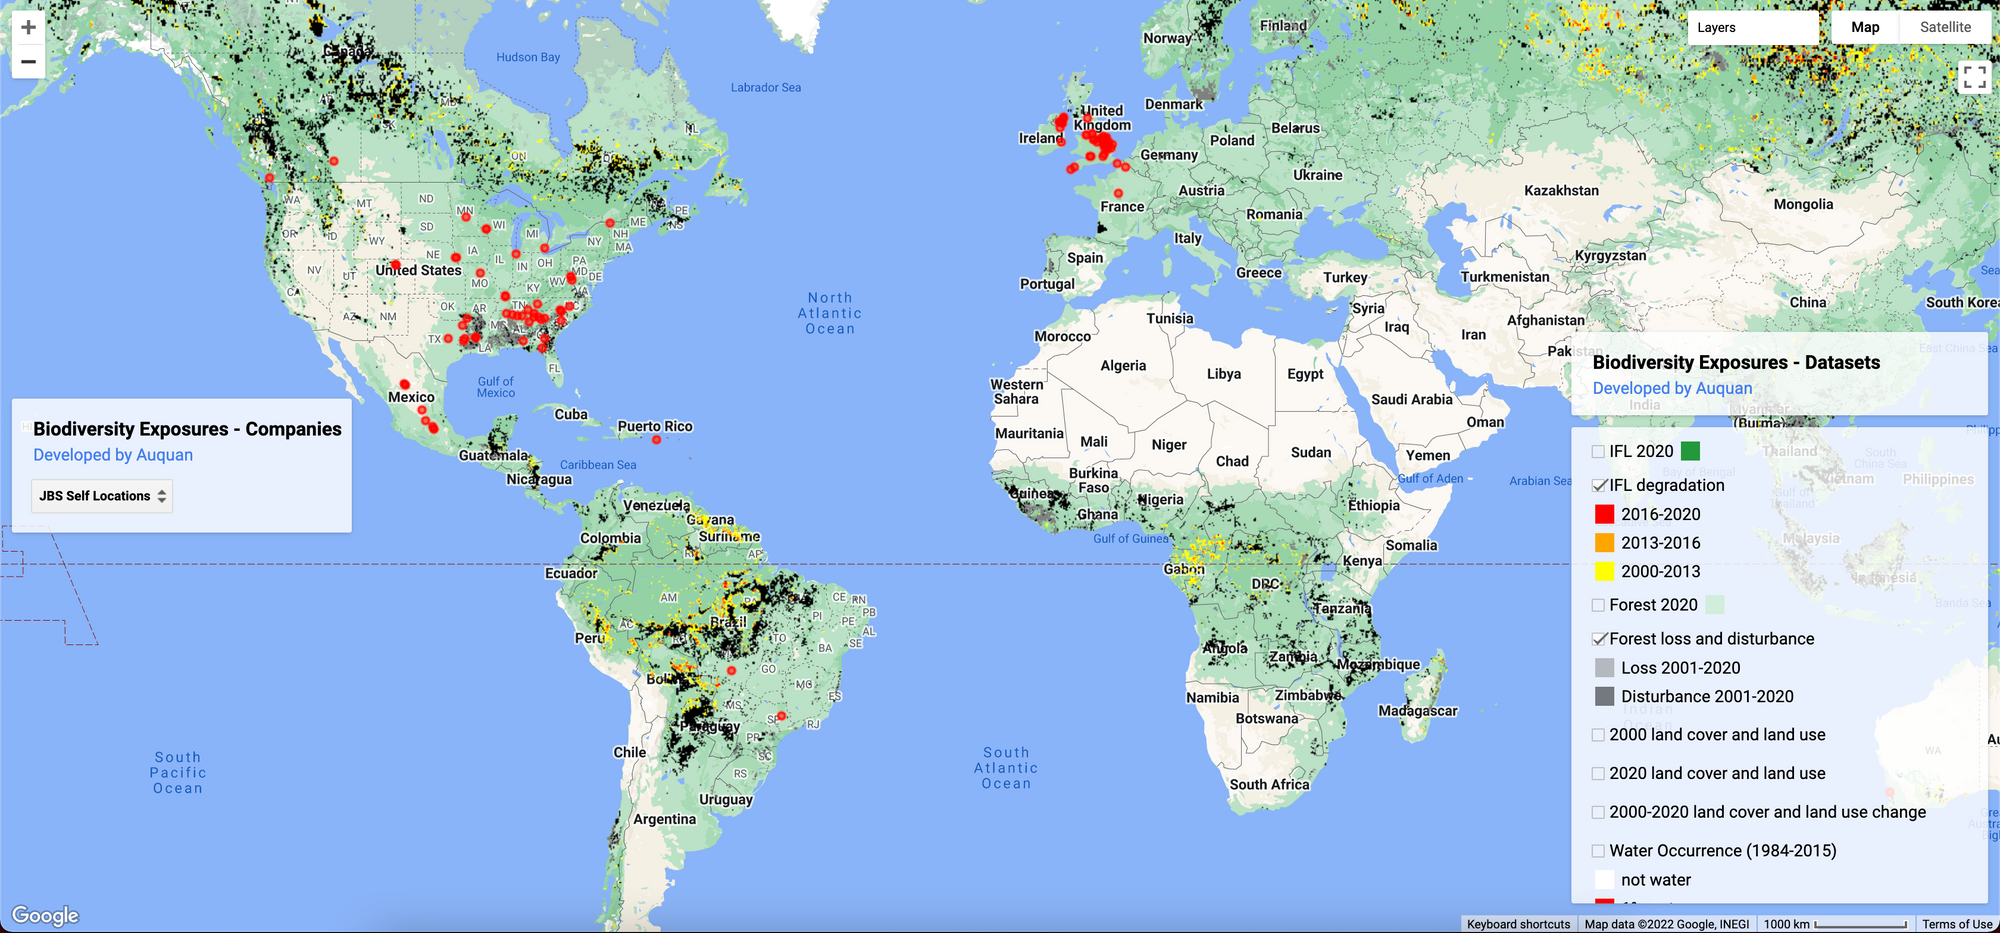
For a company like JBS, most of the deforestation will be of type "scope 2" from the suppliers of cattle feed. The map below shows locations of known suppliers of JBS (black pins), overlaid on top of same data.
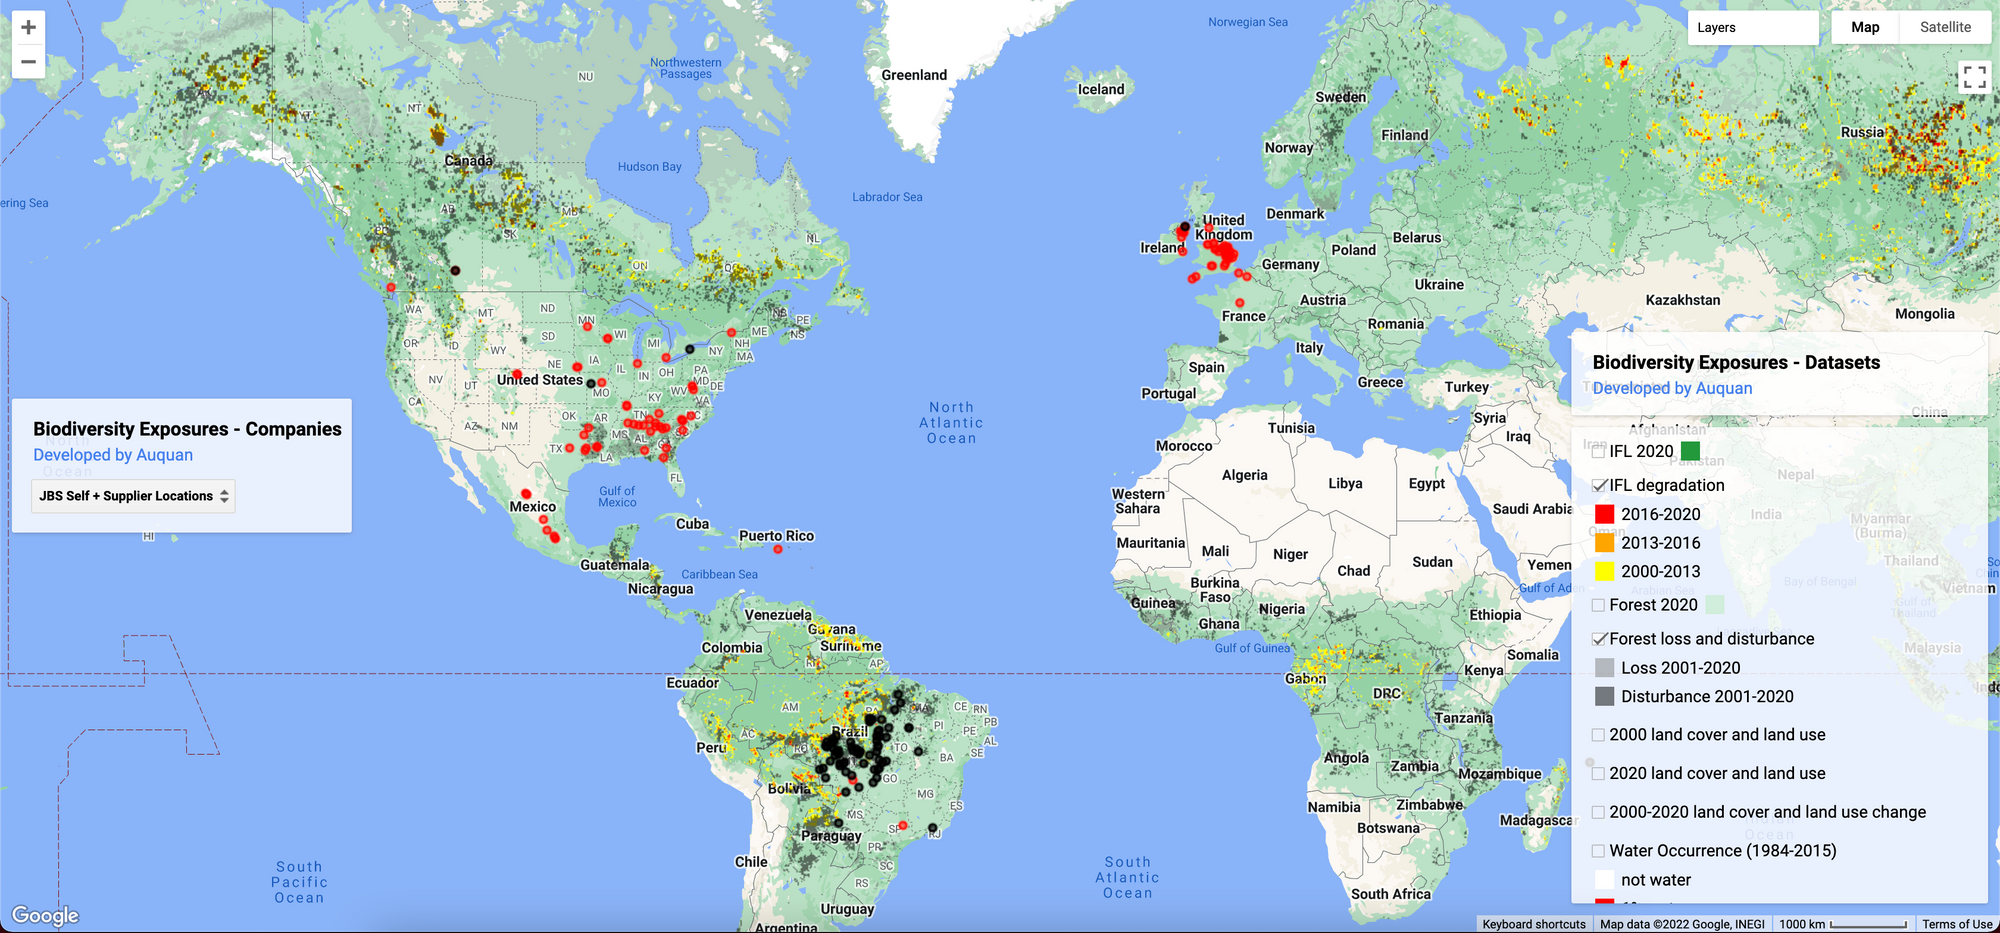
Again, we can see patches of deforestation around Brazil, so zooming in on the region indeed shows that JBS' supplier are located in the state of Matto Grosso with significant forest loss, suggesting that the company has a high negative indirect impact on the environment.
If you are interested in a similar analysis for your company, or a portfolio of investments, please reach out to us at sales@auquan.com.